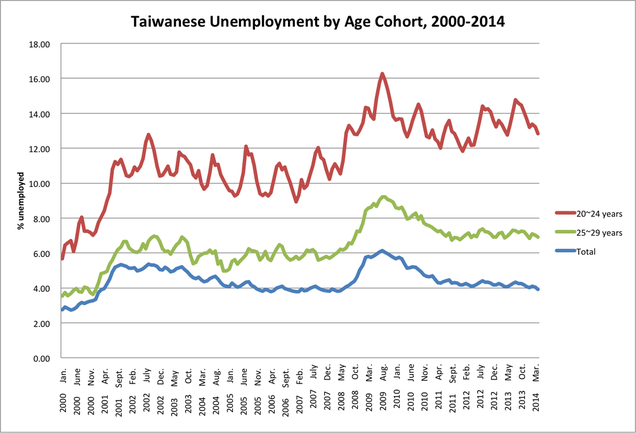
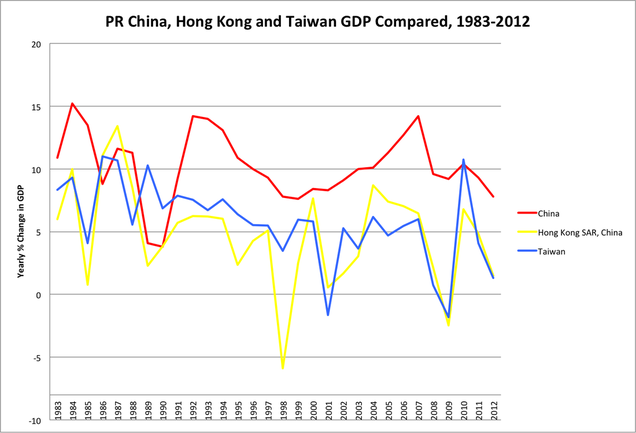
As a way to keep track of some of these data, I thought I'd post a couple figures I made a while back for a talk, along with the sources. I'd encourage anyone who's interested and can read some Chinese to explore them further at the ROC National Statistics homepage, here.
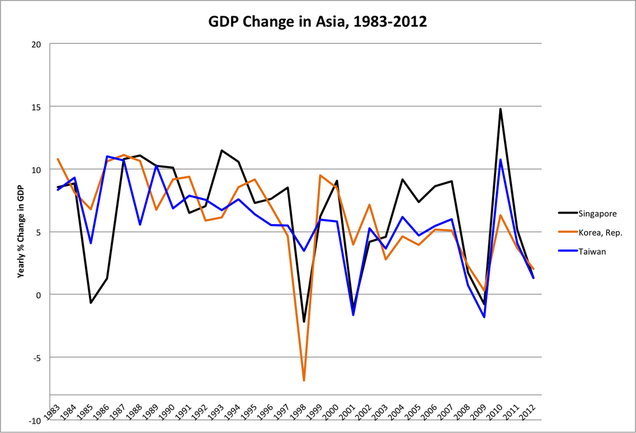
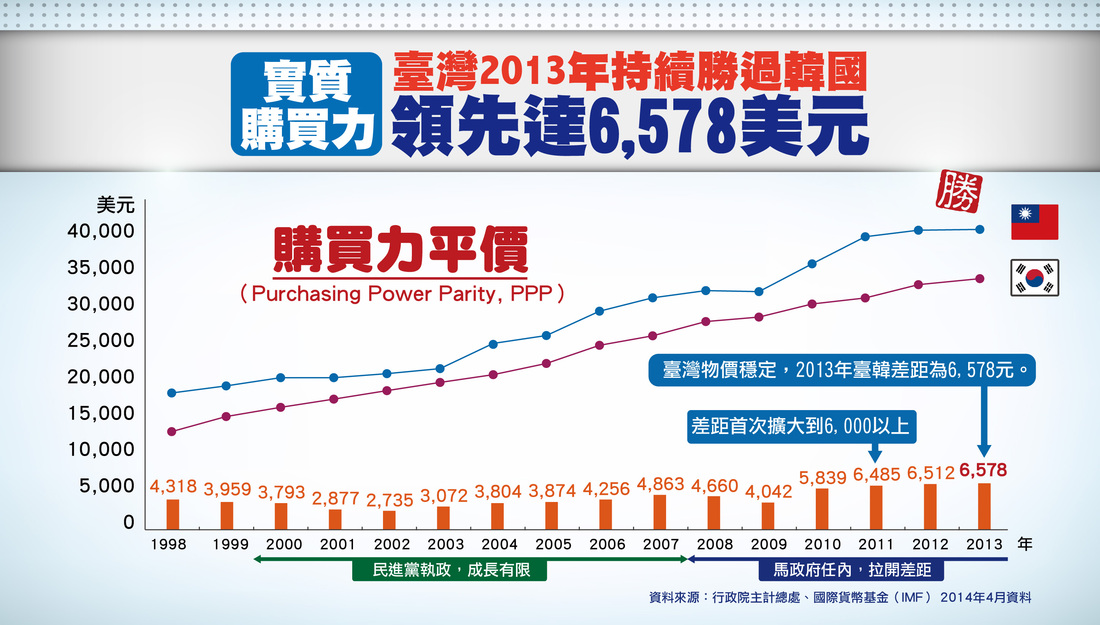
What's especially striking to me is the recent comparison with South Korea. The narrative of the Ma campaign in 2008 was that Taiwan's economy had drastically underperformed and was losing ground. By contrast, the data above show that, at least using GDP growth rates, Taiwan's growth was higher than Korea's for five consecutive years, from 2003-2007. (The economic shock that hit all of East Asia in 2008-09 originated in the United States, so it's hardly fair to blame either Chen Shui-bian or Ma Ying-jeou for the deep recession that followed.) But that generally positive story about the Chen years (2000-2008) gets turned into this (from the KMT's party website):
One other point: this is a pretty rudimentary comparison. Average per-capita income growth can also be misleading, in that rapid income growth among a small elite can move the whole average up. (In fact, that is what appears to have happened: as this article notes, average wages for salaried workers are about the same as they were in 1998, adjusted for inflation.) It would be nice to see median salary, and even better, a comparison of income inequality and its cousin, wealth inequality, measured various ways over time.
The first of these, income inequality, is shown in the figures below.
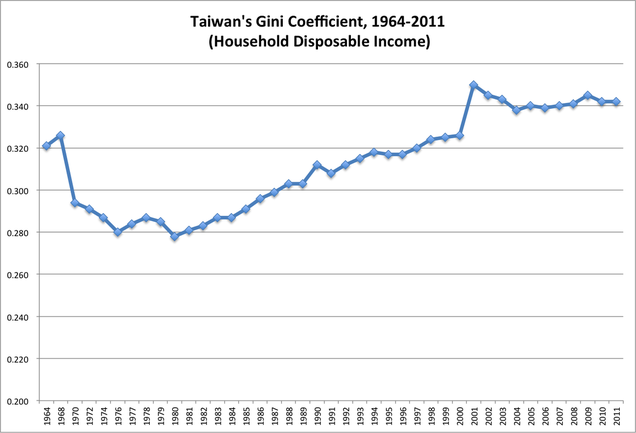
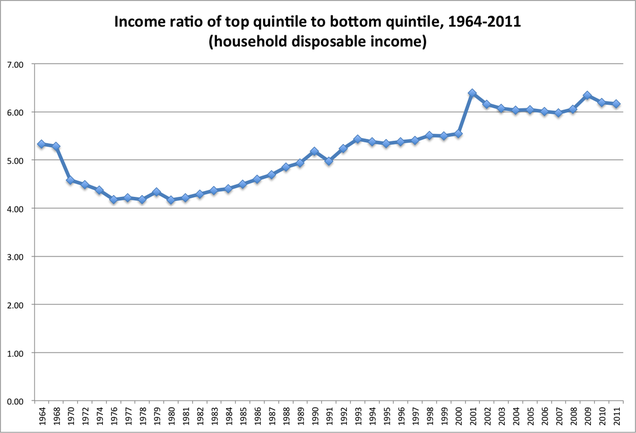
This picture is surprising given the narrative in the media about rapidly increasing inequality in Taiwan--so surprising I'm not entirely sure what's going on here. I suspect using income instead of wealth is painting a much better picture of inequality than actually exists on the ground. For one, capital gains and real estate gains are not treated like ordinary income for tax purposes in Taiwan--if a household's wealth gains come mostly from these sources, then they are potentially classified as low-income! For another, the use of quintiles in the comparison above, rather than five percent margins (as reported in this article), or even something smaller like comparing gains to the top 1% or top 0.1%, would probably paint a starker contrast. At any rate, worth investigating further, given how prominent this issue is becoming in public discourse in Taiwan. Grist for a future post...
 RSS Feed
